Data visualization
The Dietary Reference Values tool gives quick and easy access to EFSA's DRVs for nutrients and allows you to easily find values needed to make nutrition recommendations.
Data visualization
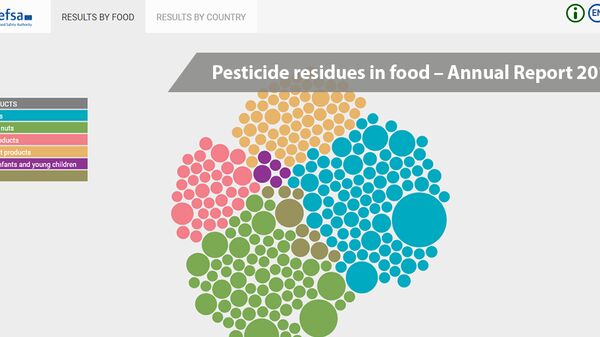
This data visualisation tool presents the main results from the monitoring of pesticide residues in food carried out in Europe in 2016.
Data visualization
Resistance of Salmonella and E. coli in food, animals and humans. Explore 2016 data country by country.
Data visualization
Mapping vector-borne diseases: 36 interactive storymaps.
Data visualization
Resistance of Salmonella and E. coli in food, animals and humans. Explore 2015 data country by country.
Data visualization
Reduce the use of antimicrobials. Replace antimicrobials with alternative treatments. Rethink the livestock production system. Find out EFSA and EMA's advice to fight against antimicrobial resistance...
Data visualization
"How do we carry out risk assessment? What's the difference between hazard and risk? Learn more about the four steps of risk assessment: hazard identification, hazard characterisation, exposure...
Data visualization
METHODS FOR EVIDENCE USEin scientific assessments.
Data visualization
Molecular typing is a way of identifying specific strains of microorganisms, such as bacteria or viruses, by looking at their genetic material. It is mainly used to pinpoint the source of foodborne...
Data visualization
Data visualization
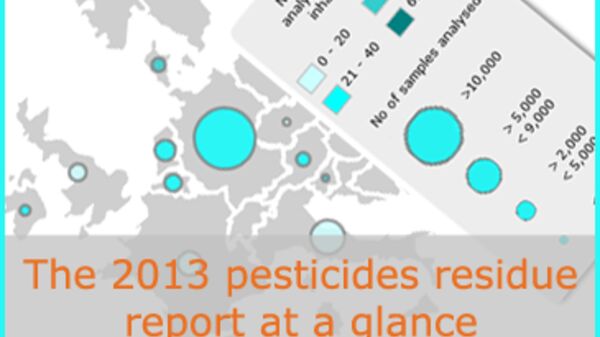
This data visualisation tool presents the main results from the monitoring of pesticide residues in food carried out in Europe in 2013.
Data visualization
Interactive infographic on Animal Diseases. How do they affect humans.


